 An official website of the Cuyahoga County government. Here’s how you know




Greenhouse Gas Emissions Inventory
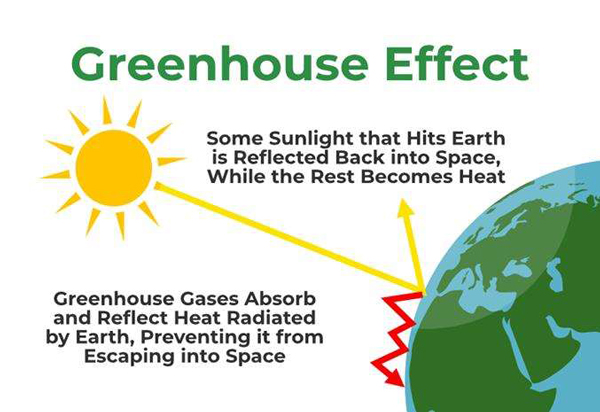
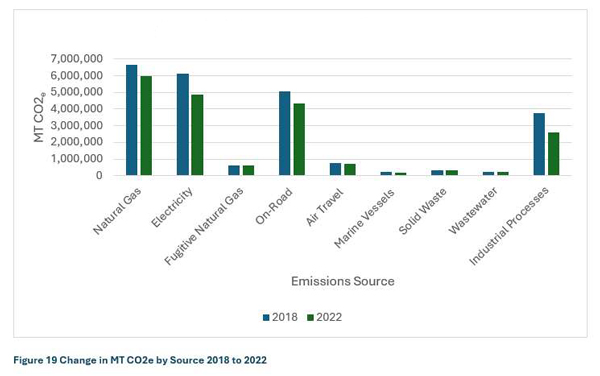
Cuyahoga County periodically conducts a county-wide greenhouse gas inventory. The latest full-year data available at the time of publication is 2022. Cuyahoga County's greenhouse gas emissions are primarily generated by the residential, commercial, industrial, and transportation sectors. Solid waste, water and wastewater utilities, and fugitive emissions comprise a smaller portion of emissions as well. The sources of emissions are generated by electricity consumption, natural gas combustion, fuel from transport emissions, and industrial process emissions.
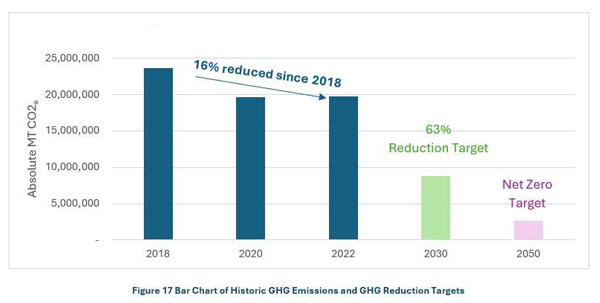
Cuyahoga County's science-based GHG reduction target is a 63% reduction in absolute emissions from our 2018 baseline by the year 2030 and net zero emissions by 2050.
GHG Emissions Change 2018-2022
Cuyahoga County 2030 Reduction target
Key terms:
Greenhouse Gas (GHG):
Any gas that absorbs infrared radiation (heat) in the atmosphere. Greenhouse gases include carbon dioxide, methane, and nitrous oxide.
Carbon Dioxide Equivalents (CO2e):
A standard unit for measuring carbon footprints that expresses the impact of all gases in the amount of CO2 it would take to create the same warming effect.
Metric Tons CO2e (MT CO2e):
Standard units for reporting GHG emissions under international protocol.